How to code GitHub style calendar heatmap in D3.js
Learning D3.js these days and getting your hand dirty with the codes? Looking for some ready-to-apply solution for your next practice project or working on some really cool assignment? you are at the right place.
I have recently created a GitHub-style calendar heat map using the D3.js library, I am going to explain my code line by line in this blog, bear with me. If you are a GitHub user you must be having such a heatmap graph in your profile section where GitHub shows the user’s contribution in a calendar year. I am going to explain this in 4 different sections.
- Understand the design requirements
- What type of data we need to draw the heat map
- Setup our application files
- D3.js code
Before reading the blog, expert users can download the code from GitHub – Click Here
1. Understand the design requirements
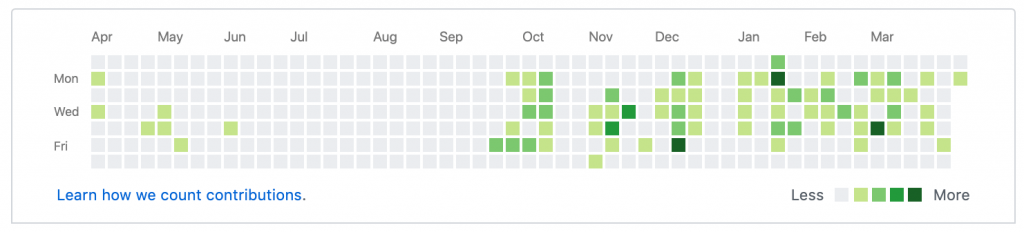
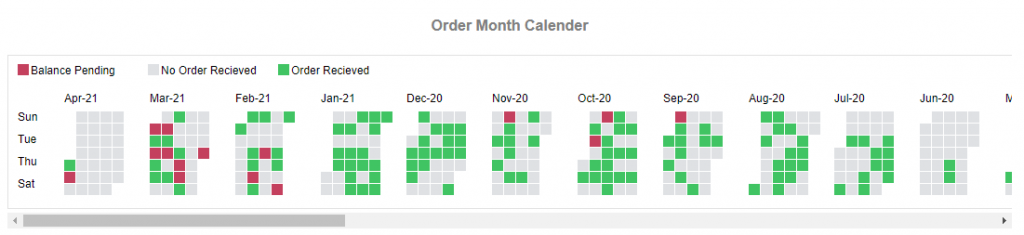
The image above is showing you the end product of GitHub. Let’s see what we can code and understand from that design. The below image is going to be our end product.
Let me edit this a bit-
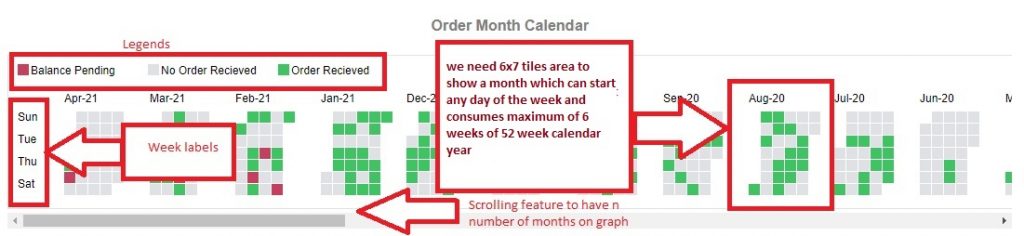
We need a 6X7 area of tiles for each month. we don’t want any overlapping of dates when a month starts on a day other than Sunday of the week for e.g. Aug 2020 starts on Saturday and ends on Monday, which means this month is overlapping a total of 6 weeks from 52 weeks in of a year. Next, we should have a separate 6X7 tile area for each month of our calendar and of course a month label. we also need a separate area for y-axis labels(week names in this case) and an area for our legends.
2. What type of data we need to draw such heat map
Below is the JSON data format you should have to achieve a heat map. loads of date values in different formats and numbers we need!!! no need to say we are dealing with a calendar here.
I tried explaining in the JSON data below what all fields are required and the desired format. there are a couple of optional fields you can skip or change as per your choice but a few are mandatory ones.
[
    {
        "DATEID":"20210401", //date of that day (YYYYMMDD)
        "DB_DATE":"2021-04-01", //date of that day (YYYY-MM-DD)
        "DAY":"1", // day of the month, from 1 to 31
        "DAY_NAME_SHORT":"Thu", //Name of the day
        "WEEKDAYNO":"4", // day number in that week(0 for Sunday 6 for Saturday)
        "WEEKNO":"13", //week no of the year (1 to 54 or 0 to 53)
        "WEEK_OF_MONTH":"0", //week no of the month(0 to 6)
        "MONTHID":"202104", // month id (YYYYMM)
        "M_NAME":"Apr-21", // Month Name, format can be your choice
        "YEARID":"2021", //year id
        "ORDER_ID":"1", //one KPI you can have any other KPI
        "TOTAL_AMOUNT":"504", //another optional KPI
        "RECIEVED_AMOUNT":"500", //optional KPI
        "DISCOUNT":"4", //optional
        "ORDER_DATE":"01-04-2021", //KPI date
        "BAL_FLAG":"1" // this flag will decide cell color
    }
]
3. Setup our application files
Including above data.json file we need 3 more file, index.html, stylesheet file style.css and our hotcake d3.js code file calendarHeatMap.js
<!DOCTYPE html>
<html lang="en">
<head>
  <meta charset="UTF-8">
  <meta name="viewport" content="width=device-width, initial-scale=1.0">
  <title>Calendar Heat Map</title>
  <link rel="stylesheet" type="text/css" href="style.css" />
</head>
<body>
    <div id = "orderHeatMap" style = "overflow-x:scroll;width:80%;margin:0 auto;">
        <center><h4 style = "font-family: Arial, Helvetica, sans-serif;color:grey;">Order Month Calendar</h4></center>
    </div>
  <script src="https://d3js.org/d3.v6.js"></script>
  <script src="calendarHeatMap.js"></script>
</body>
</html>
.svg-area
{
background-color: rgb(255, 255, 255) !important;
border:1px solid rgb(226, 226, 226);
font-family: Arial, Helvetica, sans-serif;
color:#272727 !important;
}
.heatMapMonths-labels{
/* text-anchor: middle; */
font-size: 12px;
}4. D3.js code
let’s start now with the code we are going to write in our calendarHeatMap.js file
Create a function in this file “drawHeatMap()” which will have our code and call this function at the end of the file.
async function drawHeatMap(){

       var dataset = await d3.json("Data.json");

       // dataset grouping at different levels

       var months = d3.groups(dataset, d => d.MONTHID);
       var months_name = d3.groups(dataset, d => d.M_NAME);
       var week = ["Sun","Tue","Thu","Sat"];
       var legends = ["Balance Pending","No Order Recieved","Order Recieved"];

       var box = 12; //cell size - ideal is 12 to 25

       //Dimensions
       var dim = {
           width:months.length*80+60,
           height:box*7+80,
           margin:{
               top:10,
               bottom:10,
               left:10,
               right:10
           }
       }

       dim.ctrWidth = dim.width - dim.margin.left - dim.margin.right;
       dim.ctrHeight = dim.height - dim.margin.top - dim.margin.bottom;

       // Accessor Functions:
       var balanceFlagAccessor = (d) => d.BAL_FLAG;
       var dayNameAccessor = (d)=>d.DAY_NAME_SHORT;
       var orderAmountAccessor = (d)=>d.TOTAL_AMOUNT;
       var balanceAmountAccessor = (d)=>(d.TOTAL_AMOUNT-d.DISCOUNT-d.RECIEVED_AMOUNT);
       var dateAccessor = (d) => d.DB_DATE;
       var weekDayNoAccessor = (d)=>d.WEEKDAYNO;
       var weekOfMonthAccessor = (d)=>d.WEEK_OF_MONTH;

      // colorScale
       var colorScale = d3.scaleQuantize()
       .domain([-1,1])
       .range(['#c4405e','#dfe1e4','#40c463']);

       //Parent SVG
       var svg = d3.select('#orderHeatMap')
       .append('svg')
       .attr('width',dim.width)
       .attr('height',dim.height)
       .classed('svg-area',true);

       //container
       var ctr = svg.append('g')
       .attr('transform',`translate(${dim.margin.left},${dim.margin.top})`);


       //Heat Maps Container
       var heatMapCtr = ctr.append("g")
       .attr('transform',`translate(50,30)`);

       // Week Labels
       var weekGroup = ctr.append("g")
           .attr("transform", `translate(0,${dim.margin.top+50})`)
           .selectAll("text")
           .data(week)
           .join("text")
           .style("font-size",`12px`)
           .text((d)=>d)
           .attr("y",(d,i)=>(box*2)*(i%4))
           .attr("x",0);

       // loop to render heatmaps

       for(j=0;j<months.length;j++){

           // Month Labels
           heatMapCtr.append("g")
           .attr("transform", `translate(${j*(box*6+20)},10)`)
           .append("text")
           .attr("x",0)
           .classed("heatMapMonths-labels",true)
           .text(months_name[j][0]);

           // Monthly Heatmap
           heatMapCtr.append("g")
           .attr("transform", `translate(${j*(box*6+20)},20)`)
           .selectAll("rect")
           .data(months[j][1])
           .join("rect")
           .attr("width",box)
           .attr("height",box)
           .attr("y",(d,i)=>(box+1)*((weekDayNoAccessor(d))%7))
           .attr("x",(d,i)=>(box+1)*(weekOfMonthAccessor(d)))
           .attr("fill",(d)=>colorScale(balanceFlagAccessor(d)))
           .on("mouseenter",function(e){
             d3.select(this)
             .attr("stroke","black")
             .attr("stroke-width",2);
           })
           .on("mouseleave",function(e){
             d3.select(this)
             .attr("stroke","black")
             .attr("stroke-width",0);
           })
           .append("text")
           .append("title")
           .text((d)=>"Date : "+dateAccessor(d)+", Day : "+dayNameAccessor(d)+", Sale : "+orderAmountAccessor(d)+", Balance : "+balanceAmountAccessor(d))

       }
       // Legends
       var legend = ctr.append("g")
       .attr("transform", `translate(0,10)`);

       legend.selectAll("rect")
       .data(legends)
       .join("rect")
       .attr("width",box)
       .attr("height",box)
       .attr("x",(d,i)=>140*(i%3))
       .attr("y",-11)
       .attr("fill",(d,i)=>colorScale(i-1));

       legend.selectAll("text")
       .data(legends)
       .join("text")
       .attr("x",(d,i)=>140*(i%3)+box+2)
       .attr("y",0)
       .text((d)=>d)
       .style("font-size","12px");

   }

   drawHeatMap();
Line 3- 37 – Grouping of data and legenda arrays
we need grouping of the dataset array at the month level. we need separate arrays for each month to show a month-wise heatmap and month_name grouping to use for the title purpose of that month. along with this, we need two arrays for our y-axis labels and legends. legends array values can be set according to the measure or Key values you are using in your dataset array.
We need one variable to setup the cell size, this code works perfect with the cell size of 12 (height -> 12, width – >12) and can be setup up to 25 to get the best look and feel of the heatmap.
       var months = d3.groups(dataset, d => d.MONTHID);
       var months_name = d3.groups(dataset, d => d.M_NAME);
       var week = ["Sun","Tue","Thu","Sat"];
       var legends = ["Balance Pending","No Order Recieved","Order Recieved"];
       var box = 12; //cell size - ideal is 12 to 25
Now we need our canvas dimensions( the svg element dimensions where all the heatmaps will be shown)
       //Dimensions
       var dim = {
           width:months.length*80+60,
           height:box*7+80,
           margin:{
               top:10,
               bottom:10,
               left:10,
               right:10
           }
       }

       dim.ctrWidth = dim.width - dim.margin.left - dim.margin.right;
       dim.ctrHeight = dim.height - dim.margin.top - dim.margin.bottom;
Line 29 – 36 – Setting up acccessor functions
We need an accessor function to get each individual value for a month. we need JavaScript Call-back functions which are there to give us the individual value of specific JSON objects within our dataset array, or our grouped arrays months and months_name. The below code-snippet is setting up our call back accessor functions.
       // Accessor Functions:
       var balanceFlagAccessor = (d) => d.BAL_FLAG;
       var dayNameAccessor = (d)=>d.DAY_NAME_SHORT;
       var orderAmountAccessor = (d)=>d.TOTAL_AMOUNT;
       var balanceAmountAccessor = (d)=>(d.TOTAL_AMOUNT-d.DISCOUNT-d.RECIEVED_AMOUNT);
       var dateAccessor = (d) => d.DB_DATE;
       var weekDayNoAccessor = (d)=>d.WEEKDAYNO;
       var weekOfMonthAccessor = (d)=>d.WEEK_OF_MONTH;
Line 38-57 – colorScaling and canvas setup
our colorScale function would use scaleQuantize() scaling method of d3 because we need each cell to be colored from 3 choices of colors (Red – negative, Green – positive, and Grey – for the absence of data). you can change color codes. Next, we need our canvas which will be the parent SVG tag, then one group “g” for accomodating all the heatmaps, and one set of groups “g” for each month.
       // colorScale
       var colorScale = d3.scaleQuantize()
       .domain([-1,1])
       .range(['#c4405e','#dfe1e4','#40c463']);

       //Parent SVG
       var svg = d3.select('#orderHeatMap')
       .append('svg')
       .attr('width',dim.width)
       .attr('height',dim.height)
       .classed('svg-area',true);

       //container
       var ctr = svg.append('g')
       .attr('transform',`translate(${dim.margin.left},${dim.margin.top})`);


       //Heat Maps Container
       var heatMapCtr = ctr.append("g")
       .attr('transform',`translate(50,30)`);
Line 72 – The main for loop
here we have initialize a for loop on our grouped dataset named months above. months is multidimensional array having on array for each month and element of day’s data in each row of inner array
Line 74 – 92– drawing each month label and the chart of that month
           // Month Labels
           heatMapCtr.append("g")
           .attr("transform", `translate(${j*(box*6+20)},10)`)
           .append("text")
           .attr("x",0)
           .classed("heatMapMonths-labels",true)
           .text(months_name[j][0]);

           // Monthly Heatmap
           heatMapCtr.append("g")
           .attr("transform", `translate(${j*(box*6+20)},20)`)
           .selectAll("rect")
           .data(months[j][1])
           .join("rect")
           .attr("width",box)
           .attr("height",box)
           .attr("y",(d,i)=>(box+1)*((weekDayNoAccessor(d))%7))
           .attr("x",(d,i)=>(box+1)*(weekOfMonthAccessor(d)))
           .attr("fill",(d)=>colorScale(balanceFlagAccessor(d)))
in above line of codes we are accessing individual array of each month and appending our cell using d3.js functions.
to do blank selection using the selectAll method on rect(rectangle, our cell) svg element.
Line 93 – 105 – adding hover over function and the cell titles
          .on("mouseenter",function(e){
             d3.select(this)
             .attr("stroke","black")
             .attr("stroke-width",2);
           })
           .on("mouseleave",function(e){
             d3.select(this)
             .attr("stroke","black")
             .attr("stroke-width",0);
           })
           .append("text")
           .append("title")
           .text((d)=>"Date : "+dateAccessor(d)+", Day : "+dayNameAccessor(d)+", Sale : "+orderAmountAccessor(d)+", Balance : "+balanceAmountAccessor(d))
In above mouseenter and mouseleave function you can write your code to perform any action, and title is appended to each cell so that on mouse hover on a cell, it can show the relevant data of that cell.
Line 110 – 129 – adding legends to the chart
Last but not the least, below lines are adding legends to our heatmap.
       // Legends
       var legend = ctr.append("g")
       .attr("transform", `translate(0,10)`);

       legend.selectAll("rect")
       .data(legends)
       .join("rect")
       .attr("width",box)
       .attr("height",box)
       .attr("x",(d,i)=>140*(i%3))
       .attr("y",-11)
       .attr("fill",(d,i)=>colorScale(i-1));

       legend.selectAll("text")
       .data(legends)
       .join("text")
       .attr("x",(d,i)=>140*(i%3)+box+2)
       .attr("y",0)
       .text((d)=>d)
       .style("font-size","12px");